
注意
跳转到末尾 下载完整的示例代码。
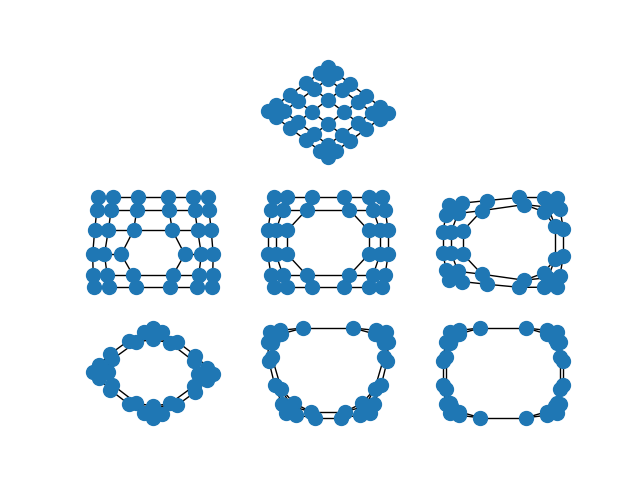
谱嵌入#
谱布局根据图的拉普拉斯矩阵 \(L = D - A\) 的特征向量来定位图中的节点,其中 \(A\) 是邻接矩阵,\(D\) 是图的度矩阵。默认情况下,谱布局会将图嵌入到二维空间中(您可以使用 dim 参数在 draw_spectral() 或 spectral_layout() 中将图嵌入到其他维度)。
当图的边表示相邻节点之间的相似性时,谱嵌入会将高度相似的节点彼此放置得更近,而将相似度较低的节点放置得更远。
当您对网格图进行谱嵌入时,这一点尤为显著。在完整的网格图中,中心节点比外围节点更分散。随着您移除内部节点,这种效应会增强。
import matplotlib.pyplot as plt
import networkx as nx


options = {"node_color": "C0", "node_size": 100}

G = nx.grid_2d_graph(6, 6)
plt.subplot(332)
nx.draw_spectral(G, **options)

G.remove_edge((2, 2), (2, 3))
plt.subplot(334)
nx.draw_spectral(G, **options)

G.remove_edge((3, 2), (3, 3))
plt.subplot(335)
nx.draw_spectral(G, **options)

G.remove_edge((2, 2), (3, 2))
plt.subplot(336)
nx.draw_spectral(G, **options)

G.remove_edge((2, 3), (3, 3))
plt.subplot(337)
nx.draw_spectral(G, **options)

G.remove_edge((1, 2), (1, 3))
plt.subplot(338)
nx.draw_spectral(G, **options)

G.remove_edge((4, 2), (4, 3))
plt.subplot(339)
nx.draw_spectral(G, **options)

plt.show()
脚本总运行时间: (0 分钟 0.153 秒)