
注意
跳到末尾下载完整的示例代码。
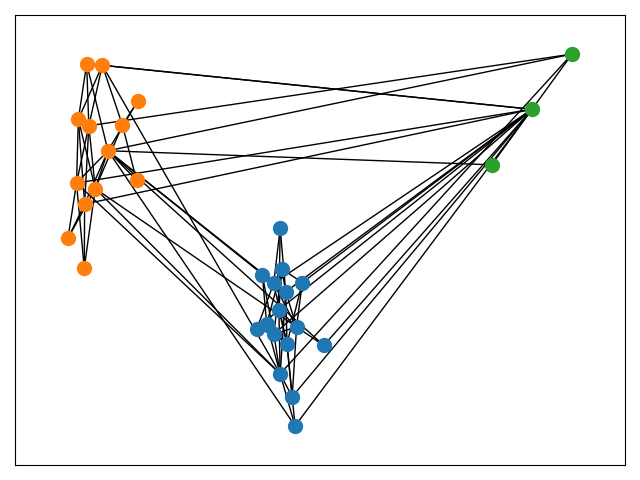
簇状布局#
本示例演示了如何组合多种布局来可视化节点簇。
这里使用的方法可以推广到可视化分层聚类,例如通过组合不同比例因子的布局来可视化节点簇的簇。
import networkx as nx
import matplotlib.pyplot as plt

G = nx.davis_southern_women_graph()  # Example graph
communities = nx.community.greedy_modularity_communities(G)

# Compute positions for the node clusters as if they were themselves nodes in a
# supergraph using a larger scale factor
supergraph = nx.cycle_graph(len(communities))
superpos = nx.spring_layout(G, scale=50, seed=429)

# Use the "supernode" positions as the center of each node cluster
centers = list(superpos.values())
pos = {}
for center, comm in zip(centers, communities):
    pos.update(nx.spring_layout(nx.subgraph(G, comm), center=center, seed=1430))

# Nodes colored by cluster
for nodes, clr in zip(communities, ("tab:blue", "tab:orange", "tab:green")):
    nx.draw_networkx_nodes(G, pos=pos, nodelist=nodes, node_color=clr, node_size=100)
nx.draw_networkx_edges(G, pos=pos)

plt.tight_layout()
plt.show()
脚本总运行时间: (0 分 0.107 秒)