
注意
前往末尾下载完整示例代码。
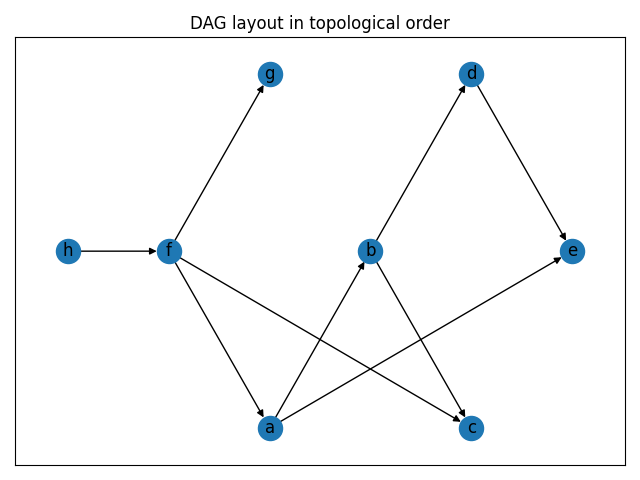
DAG - 拓扑布局#
此示例结合了 topological_generations 生成器与 multipartite_layout 布局,展示了如何按拓扑排序顺序可视化 DAG。
import networkx as nx
import matplotlib.pyplot as plt


G = nx.DiGraph(
    [
        ("f", "a"),
        ("a", "b"),
        ("a", "e"),
        ("b", "c"),
        ("b", "d"),
        ("d", "e"),
        ("f", "c"),
        ("f", "g"),
        ("h", "f"),
    ]
)

for layer, nodes in enumerate(nx.topological_generations(G)):
    # `multipartite_layout` expects the layer as a node attribute, so add the
    # numeric layer value as a node attribute
    for node in nodes:
        G.nodes[node]["layer"] = layer

# Compute the multipartite_layout using the "layer" node attribute
pos = nx.multipartite_layout(G, subset_key="layer")

fig, ax = plt.subplots()
nx.draw_networkx(G, pos=pos, ax=ax)
ax.set_title("DAG layout in topological order")
fig.tight_layout()
plt.show()
脚本总运行时间: (0 分钟 0.143 秒)