
注意
前往末尾下载完整的示例代码。
OpenStreetMap 与 OSMnx#
本示例展示如何使用 OSMnx 从 OpenStreetMap 下载并建模街道网络,可视化中心性,然后将图保存为 GeoPackage 或 GraphML 文件。
OSMnx 是一个 Python 包,用于从 OpenStreetMap 下载、建模、分析和可视化街道网络及其他地理空间特征。只需一行代码,您就可以下载并建模步行、驾驶或骑行网络,然后轻松分析和可视化它们。同样轻松地,您还可以处理城市便利设施/兴趣点、建筑足迹、公交站点、高程数据、街道方向、速度/旅行时间以及路线规划。
请参阅 https://osmnx.readthedocs.io 获取 OSMnx 文档。请参阅 gboeing/osmnx-examples 获取 OSMnx 示例图库。
import networkx as nx
import osmnx as ox
ox.settings.use_cache = True
# download street network data from OSM and construct a MultiDiGraph model
G = ox.graph.graph_from_point((37.79, -122.41), dist=750, network_type="drive")
# impute edge (driving) speeds and calculate edge travel times
G = ox.speed.add_edge_speeds(G)
G = ox.speed.add_edge_travel_times(G)
# you can convert MultiDiGraph to/from GeoPandas GeoDataFrames
gdf_nodes, gdf_edges = ox.utils_graph.graph_to_gdfs(G)
G = ox.utils_graph.graph_from_gdfs(gdf_nodes, gdf_edges, graph_attrs=G.graph)
# convert MultiDiGraph to DiGraph to use nx.betweenness_centrality function
# choose between parallel edges by minimizing travel_time attribute value
D = ox.utils_graph.get_digraph(G, weight="travel_time")
# calculate node betweenness centrality, weighted by travel time
bc = nx.betweenness_centrality(D, weight="travel_time", normalized=True)
nx.set_node_attributes(G, values=bc, name="bc")
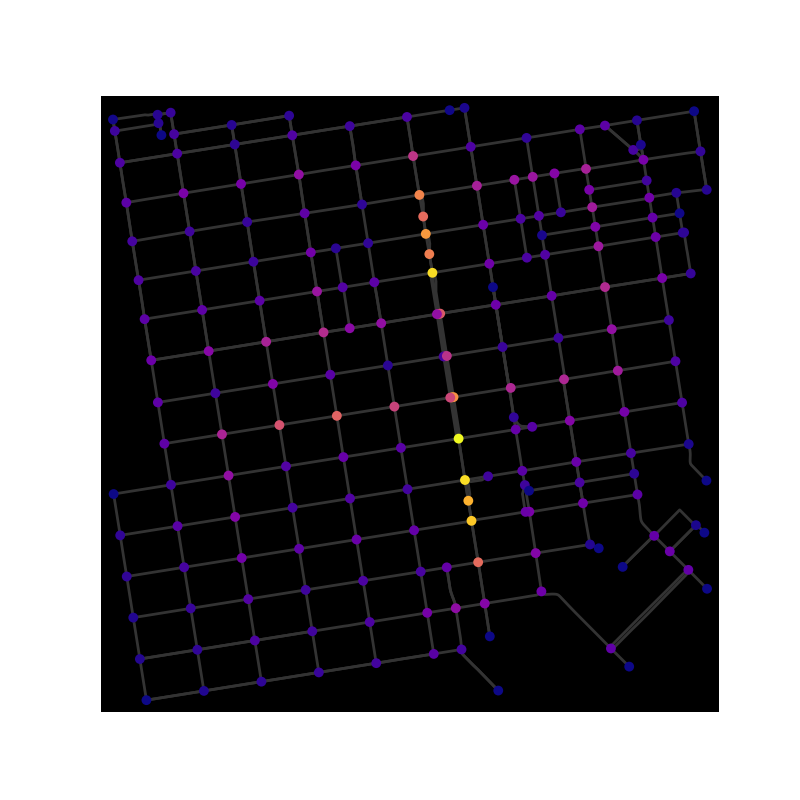
# plot the graph, coloring nodes by betweenness centrality
nc = ox.plot.get_node_colors_by_attr(G, "bc", cmap="plasma")
fig, ax = ox.plot.plot_graph(
G, bgcolor="k", node_color=nc, node_size=50, edge_linewidth=2, edge_color="#333333"
)
# save graph as a geopackage or graphml file
ox.io.save_graph_geopackage(G, filepath="./graph.gpkg")
ox.io.save_graphml(G, filepath="./graph.graphml")
脚本总运行时间: (0 分 2.836 秒)