
注意
跳转到末尾下载完整示例代码。
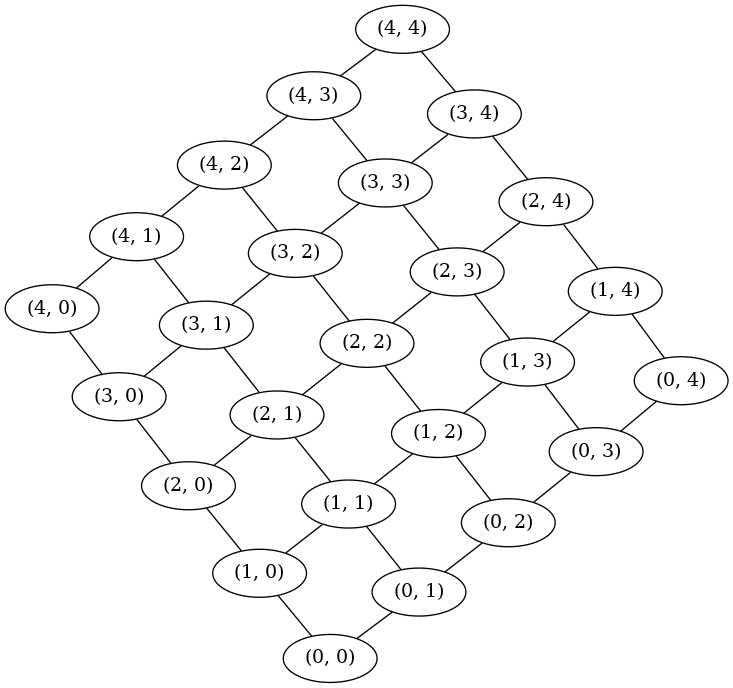
2D 网格#
演示如何结合 Graphviz 命令行界面使用 write_dot 创建可视化。
import matplotlib.pyplot as plt
import networkx as nx
从 networkx 图写入 dot 文件,以便使用 graphviz 进行进一步处理。
G = nx.grid_2d_graph(5, 5)  # 5x5 grid
# This example needs Graphviz and PyGraphviz
nx.nx_agraph.write_dot(G, "grid.dot")
# Having created the dot file, graphviz can be invoked via the command line
# to generate an image on disk, e.g.
print("Now run: neato -Tps grid.dot >grid.ps")

# Alternatively, the and image can be created directly via AGraph.draw
A = nx.nx_agraph.to_agraph(G)
A.draw("5x5.png", prog="neato")
Now run: neato -Tps grid.dot >grid.ps
脚本总运行时间: (0 分钟 0.053 秒)