
注意
跳到末尾下载完整的示例代码。
通过谱图划分进行图像分割#
通过谱聚类将从 RGB 图像通过 k-邻居 获得的无向图划分成两个子图的示例,通过原始带标签数据点在 RGB 3D 空间中的 3D 图与通过谱聚类进行图划分所做的双划分标记进行说明。所有 3D 图都使用 3D 谱布局。
参见3D 绘图以获取从这些可视化生成 3D 动画的方法。
import numpy as np
import networkx as nx
import matplotlib.pyplot as plt
from matplotlib import animation
from matplotlib.lines import Line2D
from sklearn.cluster import SpectralClustering

# sphinx_gallery_thumbnail_number = 3
创建一个示例 3D 数据集“环”。#
该数据集由 3D 中两个缠绕的带噪声的环组成。
np.random.seed(0)
N_SAMPLES = 128
X = np.random.random((N_SAMPLES, 3)) * 5e-1
m = int(np.round(N_SAMPLES / 2))
theta = np.linspace(0, 2 * np.pi, m)
X[0:m, 0] += 2 * np.cos(theta)
X[0:m, 1] += 3 * np.sin(theta) + 1
X[0:m, 2] += np.sin(theta) + 0.5
X[m:, 0] += 2 * np.sin(theta)
X[m:, 1] += 2 * np.cos(theta) - 1
X[m:, 2] += 3 * np.sin(theta)
Y = np.zeros(N_SAMPLES, dtype=np.int8)
Y[m:] = np.ones(m, dtype=np.int8)

# map X to int8 for 8-bit RGB interpretation for drawing
for i in np.arange(X.shape[1]):
    x = X[:, i]
    min_x = np.min(x)
    max_x = np.max(x)
    X[:, i] = np.round(255 * (x - min_x) / (max_x - min_x))
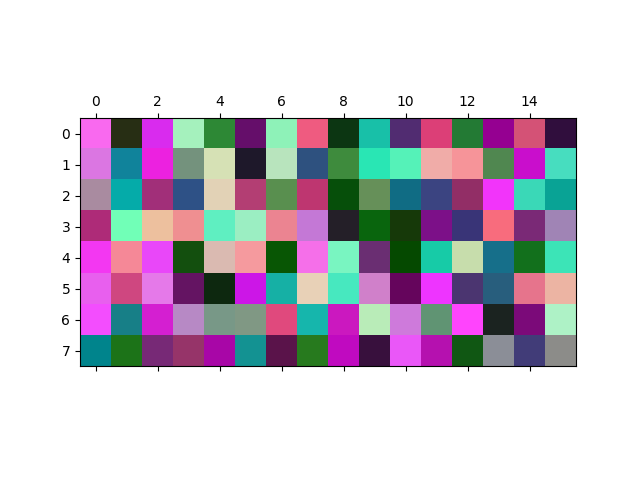
将 RGB 数据集绘制为图像。#
这 128 个 3D 数据点中的每一个都可以视为像素的 RGB 值。我们通过将其绘制成 8x16 像素的图像来展示数据集,像素随机放置在 8x16 网格中。数据中的精细结构在图像中视觉上无法检测到。
perm = np.random.permutation(X.shape[0])
rgb_array = X[perm, :].reshape(8, 16, 3).astype(int)
fig, ax = plt.subplots()
ax.matshow(rgb_array)
plt.show()
生成图并确定两个簇。#
图是使用“最近邻”构建的,两个簇是通过谱聚类/图划分确定的。
NUM_CLUSTERS = 2
sc = SpectralClustering(
    n_clusters=NUM_CLUSTERS,
    affinity="nearest_neighbors",
    random_state=4242,
    n_neighbors=10,
    assign_labels="cluster_qr",
    n_jobs=-1,
)
clusters = sc.fit(X)
cluster_affinity_matrix = clusters.affinity_matrix_.getH()

pred_labels = clusters.labels_.astype(int)
G = nx.from_scipy_sparse_array(cluster_affinity_matrix)
# remove self edges
G.remove_edges_from(nx.selfloop_edges(G))

cluser_member = []
for u in G.nodes:
    cluser_member.append(pred_labels[u])
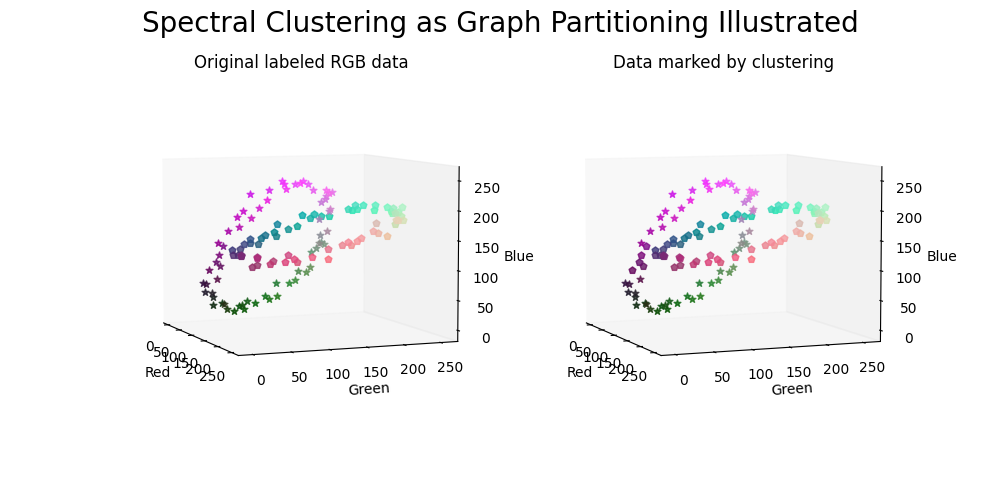
生成数据的图。#
数据点根据原始标签(左侧面板)和通过聚类(右侧面板)进行标记。
def _scatter_plot(ax, X, array_of_markers, axis_plot=True):
    # `marker` parameter does not support list or array format, needs a loop
    for i, marker in enumerate(array_of_markers):
        ax.scatter(
            X[i, 0],
            X[i, 1],
            X[i, 2],
            s=26,
            marker=marker,
            alpha=0.8,
            color=tuple(X[i] / 255),
        )
    if axis_plot == True:
        ax.set_xlabel("Red")
        ax.set_ylabel("Green")
        ax.set_zlabel("Blue")
    else:
        ax.set_axis_off()
    ax.grid(False)
    ax.view_init(elev=6.0, azim=-22.0)


# select the second half of the list of markers for better visibility
list_of_markers = Line2D.filled_markers[len(Line2D.filled_markers) // 2 :]

fig = plt.figure(figsize=(10, 5))
fig.suptitle("Spectral Clustering as Graph Partitioning Illustrated", fontsize=20)

ax0 = fig.add_subplot(1, 2, 1, projection="3d")
ax0.set_title("Original labeled RGB data")
array_of_markers = np.array(list_of_markers)[Y.astype(int)]
_scatter_plot(ax0, X, array_of_markers)

ax1 = fig.add_subplot(1, 2, 2, projection="3d")
ax1.set_title("Data marked by clustering")
array_of_markers = np.array(list_of_markers)[pred_labels.astype(int)]
_scatter_plot(ax1, X, array_of_markers)

plt.show()
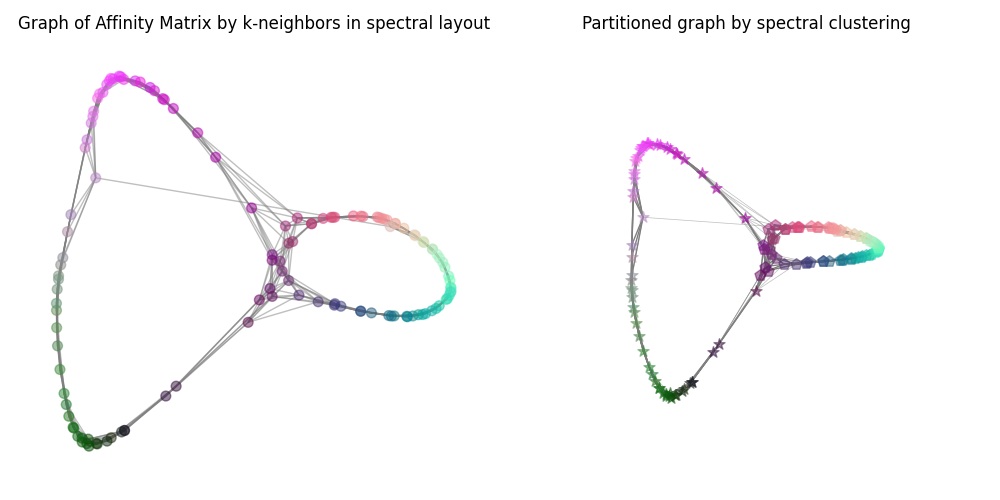
生成图的图。#
图的节点根据聚类进行标记。
# get affinity matrix from spectral clustering
weights = [d["weight"] for u, v, d in G.edges(data=True)]

fig = plt.figure(figsize=(10, 5))
ax0 = fig.add_subplot(1, 2, 1)
ax0.set_title("Graph of Affinity Matrix by k-neighbors in spectral layout")
pos = nx.spectral_layout(G)
nx.draw_networkx(
    G,
    pos=pos,
    alpha=0.5,
    node_size=50,
    with_labels=False,
    ax=ax0,
    node_color=X / 255,
    edge_color="Grey",
)
plt.box(False)
ax0.grid(False)
ax0.set_axis_off()

ax1 = fig.add_subplot(1, 2, 2, projection="3d")
ax1.set_title("Partitioned graph by spectral clustering")
pos = nx.spectral_layout(G, dim=3)
nodes = np.array([pos[v] for v in G])
edges = np.array([(pos[u], pos[v]) for u, v in G.edges()])
point_size = int(800 / np.sqrt(len(nodes)))


def _3d_graph_plot(ax):
    for i, marker in enumerate(array_of_markers):
        ax.scatter(
            *nodes[i].T,
            s=point_size,
            color=tuple(X[i] / 255),
            marker=marker,
            alpha=0.5,
        )
    for vizedge, weight in zip(edges, weights):
        ax.plot(*vizedge.T, color="tab:gray", linewidth=weight, alpha=weight)
    ax.view_init(elev=100.0, azim=-100.0)
    ax.grid(False)
    ax.set_axis_off()


_3d_graph_plot(ax1)
plt.tight_layout()
plt.show()
脚本总运行时间: (0 分钟 2.512 秒)